LED manufacturer Bridgelux has announced a quality-of-light metric for white LEDs, or even solid-state lighting (SSL) end products, called Average Spectral Difference (ASD) that is intended to provide a simple way for product developers, lighting designers/specifiers, and other lighting professionals to easily understand how the output of an LED compares to so-called “natural light.” ASD is based on details in the spectral power distribution (SPD) of an LED and how that SPD compares with the SPD of a reference illuminant that’s considered representative of natural light. ASD is expressed as a percentage with 0% representing performance equivalent to the natural reference.
We’ll get back to the ASD details in a second, but first let’s address the caveats of the concept that does in fact have merit. The LED sector has been the venue for a heated race toward naturalness for several years now. Presumably, human physiology has evolved for eons under the natural light of the sun and that light has a very uniform SPD. Seoul Semiconductor was first to explicitly tout a natural spectrum with the introduction of the SunLike technology back in 2017.
But the concept of natural light is itself undefined and up to individual argument. And perfect light quality metrics have proven an impossible dream thus far. The industry has far better tools for characterizing light today than even a couple of years ago. But challenges and inconsistencies remain.
We do believe that a movement toward higher quality of light is a great thing for our industry. It will improve acuity, ease eyestrain, and perhaps improve our wellbeing. And it might just dig the LED and SSL sectors out of the trough of commoditization and deliver renewed business potential.
Bridgelux, at least in part, developed the ASD concept because the company offers the Thrive portfolio of LEDs that has a very uniform SPD. And metrics such as CRI or even IES TM-30 don’t fully reveal the quality or naturalness story. We first covered Thrive a little more than a year back when the company first demonstrated the technology at LEDucation. The LED architecture employs dual blue pumps — one at about 430 nm and the second at about 480 nm. The approach spreads the blue energy and eliminates the telltale blue peak common in phosphor-converted white LED SPD. From day one, Bridgelux has shown Thrive SPD comparisons to reference sources including the blackbody curve and CIE reference illuminants such as D50.
Now Bridgelux is quantifying the SPD comparison into a single number that it believes industry professionals can easily use to compare LEDs and lighting products, and to grasp a realistic expectation about the performance of such sources. ASD is a calculated percentage with a lower number intended to indicate a more natural source.
ASD sounds relatively simple, and the calculation is simple, but the quality and color science behind it is complex. In all cases, ASD is specific to a color temperature expressed as CCT in degrees Kelvin (K). The ASD calculation is made relative to the blackbody curve for CCTs of 4000K and warmer. For cooler CCTs, the metric uses standard CIE illuminant references such as D50, D57, and D65 for 5000K, 5700K, and 6500K sources, respectively. That set of reference sources tracks the techniques applied in IES TM-30.
But ASD is calculated by comparing SPDs and capturing the difference between test and reference sources at each wavelength (1-nm intervals), converting that difference to a percentage, and then averaging the differences over a range of wavelengths of interest. Bridgelux is proposing that the calculation include 266 1-nm samples over the range of 425–690 nm. The company states that those bounds include 99.9% of the area under the V(λ) (pronounced “V lambda”) photopic response curve.
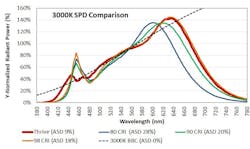
Not surprisingly, Bridgelux has sample results for its LEDs readily available and the graph is pictured nearby. The graph compares the Thrive LEDs with other Brideglux LEDs of varying CRI and TM-30 performance ranges. The example shown is for 3000K LEDs with the reference being the blackbody curve.
The takeaway is simple from Bridgelux’s perspective. The company’s Décor LED is the 98-CRI LED on the graph. That LED essentially matches the Thrive LED in terms of CRI, and the TM-30 scores are close. The Thrive LED has a TM-30 fidelity Rf measure of 98 and a gamut Rg measure of 101, whereas the Décor LED is rated at 94 and 102, respectively. You might expect that the two LEDs deliver very close performance in terms of light quality.
A comparison of ASD and this naturalness concept, however, shows a larger performance gap. Thrive ASD is 9%. Décor is double the Thrive number at 18%. And of course other Bridgelux LEDs have far larger ASD ratings.
Ultimately, the question remains whether the comparison to the reference sources really matters. Bridgelux thinks it does.
“The market is evolving to human-centric lighting,” said Brian Cumpston, vice president of solutions development at Bridgelux. “While there are several approaches to developing human-centric lighting solutions, delivering the closest match to natural light is of great interest to our customers. Thrive has been developed to address this demand, and the new ASD metric developed by Bridgelux provides an objective and quantitative way to compare light sources and determine how closely they match the spectra of natural light. We hope this new metric will be broadly adopted in the lighting industry to provide new insight into naturalness beyond CRI and TM-30.”
For up-to-the-minute LED and SSL updates, why not follow us on Twitter? You’ll find curated content and commentary, as well as information on industry events, webcasts, and surveys on our LinkedIn Company Page and our Facebook page.


