JIANZHONG JIAO describes how new methods for projecting catastrophic LED failures can lead to SSL product manufacturers' ability to accurately set warranties, and for users to have informed expectations about product reliability and life.
The Illuminating Engineering Society (IES) has published yet another Technical Memorandum (TM) for use by the LED industry and solid-state lighting (SSL) developers. The TM-26 document describes several methods by which developers can project catastrophic failure rates in LED sources. Such failures combine with lumen maintenance to accurately characterize the reliability and expected lifetime of LED-based products.
Interested in more articles & announcements about LED standards?
In the October 2011 issue of LEDs Magazine, we published an article titled "Understanding the difference between LED rated life and lumen-maintenance life." That earlier article pointed out the difference between an LED's lumen-maintenance life and its rated life. Prior to LEDs, rated life for light sources traditionally included catastrophic failure, in which the light sources no longer produce light.
LEDs do fail catastrophically, though the rate is much lower compared to other light sources. When designing LED lamps or luminaires, the requirement of LEDs' lumen-maintenance life aside, it is also important to know the LEDs' catastrophic failure rate. The reliability and associated warranty for an LED lighting product is essentially based on both the LEDs' lumen-maintenance life and the catastrophic failure rate. The calculation of catastrophic failure rates is an important metric in assessing the reliability performance of an LED lighting product. This failure data can be used as a benchmark for future performance or an assessment of past performance, which may present a need for product or process improvement.
Testing committee work
During the timeframe in which the aforementioned article was published, the IES Testing Procedures Committee (TPC) formed a working group to develop a document addressing the projection of LEDs' failure rate. IES TM-26, "Methods for projecting catastrophic failure rate of LED packages," has just now been published, after more than four years of hard work.
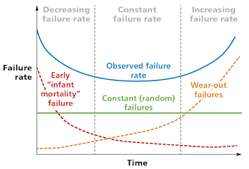
Catastrophic failure rates for LED packages are typically in the range of parts per million hours or parts per billion hours of operation. In the semiconductor and electronics industry, component-level failure rate often refers to empirical population failure rates. Such rates change as components age over time; and the general failure rate trends can be summarized by a graph or a curve. Due to the bathtub-like shape of the failure-rate curve, it has become widely known as the "bathtub curve." In reviewing the industry's practices, the IES TPC working group decided to use the bathtub curve as the basis for describing LEDs' failure rate (see figure).
The bathtub curve includes three periods: early failure period, stable failure period, and wear-out failure period. In the early failure period, LED products may be characterized by a rapidly decreasing catastrophic failure rate. Based on the manufacturing experience, the typical catastrophic failures that occur during this period of time may be caused by material defects. The early failure period may typically last several hours to a few hundred hours. LED manufacturers usually use the screening, or product burn-in period, to reduce the duration of the early failure period.
After the early failure period, the failure rate levels off and remains relatively constant, in typical cases, for the majority of the useful life of LEDs. In this long and relatively constant failure-rate period, the probability of catastrophic failure can be modeled by the exponential cumulative distribution function over time. If LEDs remain in use long enough, the catastrophic failure rate begins to increase as materials wear out, and degradation failures occur at an ever increasing rate, which is the wear-out failure period.
Projection models
In general, a reliable projection or prediction model for catastrophic failures over time should be based on experimental observations. The Weibull statistical model is a widely used empirical model; other mathematical models based on device physics can sometimes be a better fit to the data. All best fit models shall be based upon statistically significant sample populations such as typical manufactured parts, well-established reliability methodologies, and validated mathematical models based upon device physics. Experts in the IES TPC reviewed all available methods of LED failure-rate projections in practice in the industry, and established recommendations based on these commonly used methods. To help both LED producers and the users, TM-26 listed three recommended methods for projecting LED failure rate.
The first method is to report the catastrophic failure rate based on an LED manufacturer's statistical data. Statistical data can be accumulated from field data or quality management information. Without using any specific model, provided the LED manufacturer has sufficient information regarding LEDs' failure rate from its statistical data, such data can be reported and used as the projection for its product datasheet. Because LEDs' failure rate can be related to its case or junction temperature, as well as its forward current, the reported failure rate should include a given case or junction temperature and a given forward current.
The failure rate is usually the catastrophic failure in units per one billion hours of operation as stated previously. Using this method, LED users can have an overview for the LED package failure rate. For example, an LED package has 1000 failure units per one billion hours of operation at 105°C and at its maximum forward current. If an LED luminaire is designed to use 100 LEDs at the specified temperature of 105°C and the maximum forward current, then ten of these LED luminaires may fail (assuming one LED failure is equivalent to one luminaire failure) per one million operation hours.
Further, if these luminaires are designed to be operating for 50,000 hours, and 20 luminaires are used in one project, then it is predicted that at the end of 10,000 hours, there will be one luminaire failure in this project. When the luminaire manufacturer is establishing its quality claim or warranty policy, this information can be imperative to users.
Empirical model
The second method uses an empirical model that is utilized in the semiconductor and LED industries. This model first establishes a reference failure rate at a reference temperature and a reference forward current - for example, 55°C and 50% of maximum current, respectively. This reference failure rate is also typically determined based on production quality or usage data.
In real-life applications, the failure rate is related to the reference failure rate, which multiplies a temperature stress factor and a current stress factor. For the temperature-dependent stress factor, the mathematical expression is provided in TM-26, and is based on the activation energy of the LED from empirical data, which is a property of the LED die material and structure. For the current-dependent stress factor, the method uses a mathematical expression that is again based on the empirical data.
The "bathtub curve" hazard function (blue, upper solid line) is a combination of a decreasing hazard of early failure (red dotted line) and an increasing hazard of wear-out failure (yellow dotted line), plus some constant hazard of random failure (green, lower solid line).
Source: McSush (talk) - Bathtub_curve.jpg, Public Domain (http://bit.ly/20XKxPm).
In a real-life driving-current situation, the ratio of the operation current versus the reference current is presented with coefficients. These coefficients that are also based on the empirical information are provided in the method. When using this method, the stress factor of temperature dependence and stress factor of current dependence can be obtained from TM-26 once the operating temperature and current is designed, then the failure rate associated with the real-life temperature and current can be projected. When an LED-based product is used in a different LED lamp or luminaire design, with each corresponding real-life temperature and current, a failure rate can be calculated, respectively.
Military influence
The third method provided by TM-26 is an approach similar to military standards. For the temperature stress factor, a mathematical expression for failure in time (FIT) is provided. Real test data, including number of devices tested, number of catastrophic failures presented during the test, and equivalent device operation hours are the parameters used in the expression. In conjunction with a defined statistic distribution, including degrees of freedom and the degree of confidence level, the expression can be used to calculate and project the failure rate. The temperature stress factor associated with the LED activation energy is integrated for the duration of the test. For the current stress factor, the Eyring model is recommended and the expression is provided.
As stated in the TM-26 scope, "the three methodologies presented are for information only and do not represent a complete set of methodologies in existence; these represent the methodologies that are publicly available, and have been made available, for publication by the IES." TM-26 provides reference information that allows LED producers and users to communicate in regard to the product reliability measure. If the failure-rate projection methods for LED packages are available, the catastrophic failure rate of LED modules or arrays can also be determined either by summation of the catastrophic failure rate of each individual LED package, or directly at the LED array or module level using the methods described in TM-26.
The work accomplished by the IES TPC experts will add value for LED adoption in the lighting industry. Using LM-80 test data and the TM-21 calculator, the LED lumen-maintenance life can be projected. Now, with TM-26, LEDs' catastrophic failure rate can be projected. The combination of these tools should give LED lamp and luminaire manufacturers higher confidence levels to more accurately project product reliability, and product reliability will certainly benefit the LED end users.
DR. JIANZHONG JIAO, an internationally recognized lighting expert, is an independent consultant for LEDs and lighting technologies. He has been actively involved in LED and LED lighting standard development activities, technical conferences, and industry consortia. Currently he serves on the IESNA Testing Procedures, Roadway Lighting, Computer, and Light Source Committees. He is also vice chair of the ANSI SSL Light Source Working Groups, and at present works with many other technical organizations, groups, and symposia, in addition to being a member of the Technical Panel of Strategies in Light. He can be reached at [email protected].


