This article was published in the July/August 2012 issue of LEDs Magazine.
+++++
In the second of a multi-part series of articles, we continue our exploration of color science – in particular as it applies to LED lighting. This article will focus on the CIE Chromaticity Diagram and the science behind the Planckian locus that plots blackbody radiators on the diagram. After reading the article, you will understand why LEDs are a near-ideal artificial light source in terms of matching the spectral power distribution (SPD) of a blackbody radiator and limiting energy emission to the visible spectrum. That understanding will prepare you for our next installment that moves on to designing solid-state lighting (SSL) products that take advantage of this unique LED property.
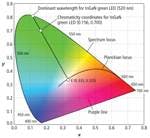
As we discussed previously, each of the three types of cone receptors has distinct yet overlapping spectral response curves (Fig. 1). The color perceived is determined by the relative output of these three types of cones. In this process a tremendous amount of information is lost regarding the SPD of the light falling on the retina. A spectroradiometer with a 2-nm spectral-sampling resolution collects approximately 200 times the amount of information relating to a particular light’s SPD than the eye does. Even though the eye effectively ignores this information, it can still resolve millions of colors. The 1931 CIE color standard exploits this principle to produce a metric that can identify any color with just two numbers, the CIE x, y color coordinates (Fig. 2).
Applying the CIE Diagram
The CIE Diagram has many uses, the most common in the LED industry is the specification of color or chromaticity bins by LED manufacturers. It has several important additional features that require some explanation. First not all values of x and y have an associated color. The values of x and y for valid colors are bounded by the spectrum locus and the purple line. The spectrum locus is a curve that plots the x, y values for colors consisting of single wavelength light ranging the whole visible spectrum. It is rather straightforward to calculate the spectrum locus by simply reading the X, Y, Z values from the CIE color matching curves for each wavelength and then calculating the corresponding CIE chromaticity coordinates. For more information on that process, see the sidebar from part 1 of this article, “Plotting a light source on a chromaticity diagram.”
As you might already be aware there is no single white. The closest thing to a single white is the equal energy white, E. It is defined as the x, y coordinate of an SPD that has equal intensity or energy at every wavelength in the visible spectrum. The CIE 1931 color matching functions are each normalized so their integrals over the visible spectrum are all equal. This means that the tristimulus values for equal energy white (E) will all be equal, (X = Y = Z) which results in x = y = 1/3 (Fig. 2). Equal energy sources are of theoretical interest only since they do not occur in nature and would be prohibitively expensive if not impossible to create artificially.
There are two technical terms relating to hue and saturation that have explicit definitions with regard to the CIE diagram, namely dominant wavelength (hue) and purity (saturation). The dominant wavelength of an LED is defined as the wavelength on the spectrum locus intersected by a line from E through the x, y coordinates of the LED (Fig. 2). The color purity of an LED is determined by the position of the LED’s x, y coordinates along this line. Purity is 0 if its x, y coordinates are coincident with E. It increases as it moves along the line toward the spectrum locus, reaching a maximum of 1 at the spectrum locus.
Mixing colors
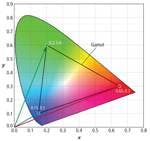
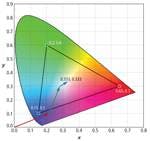
These equations can be extended to calculate the chromaticity coordinates of a mixture of any number of sources. We can interpret the two equations above as a vector addition, where each component of the sum in the numerator are the x and y components of vectors that point at the chromaticity coordinates of each source (Fig. 3). The denominator of these equations scales each of these vectors so the magnitude of the addition of the three vectors is equal to the chromaticity coordinates (xm, ym) of the mixture. Fig. 4 shows this addition graphically by placing the vectors end to end starting with the red source vector pointing from the origin of the CIE Diagram and ending with the vector for the blue source pointing at the coordinates of the mixture, which in this case is xm = 0.333 and ym = 0.333.
Since these two equations form a linear set we can use them to calculate the relative brightness values k1 , k2 and k3 required for a mixture to have a desired set of chromaticity coordinates of xm, ym. With three primary sources in the mixture we have three unknowns and only two equations so the problem appears to be underdetermined. This can easily be remedied by adding a third equation,The third equation simply means that the addition of the brightness of the three primaries should add to a desired brightness of the mixture, km. We are using brightness here in a rather loose manner. The photometric quantity and the units of the ki coefficients depend on the application. For luminaires, brightness would refer to photometric flux (lm). For a display, brightness would refer to luminance (nits) and for an indicator lamp brightness would refer to intensity (cd).
Color mixtures with four primaries such as in a RGBW LED are undetermined, meaning there are more than one solution for the brightness of each LED to create a given x, y coordinate and a given brightness. An additional constraint is therefore required to solve for xm, ym.
The Planckian locus
Another common feature often found on CIE Diagrams especially those relating to white LEDs is the Planckian locus, which starts at the long wavelength (red) end of the spectrum locus and curves up and to the left through the white region in the center of the CIE Diagram (Fig. 2). The Planckian locus is the plot of the chromaticity coordinates of light sources known as blackbody radiators that generate light due to their thermal energy. Light is electromagnetic radiation and technically is radiation only from the visible portion of the electromagnetic spectrum. There is no such thing as “infrared light” or “ultraviolet light” even though little confusion arises from using these terms.
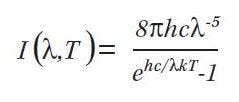
All electromagnetic radiation is generated by the acceleration (and deceleration) of electrically charged particles. The two primary mechanisms for accelerating charged particles are thermal energy of atoms and molecules (as in a blackbody radiator) and the transition of electrons from one atomic energy level to a lower atomic energy level. Molecules of any solid, liquid or gas that has a temperature above zero Kelvin are in constant motion, continually vibrating or colliding with each other. Each vibration and collision accelerates a charged particle resulting in electromagnetic energy radiating away from the charged particle. This process is highly random, but its macroscopic nature can be predicted very accurately by a mathematical model of a blackbody radiator known as Planck’s Law represented by the below equation.
For a given temperature T, the equation generates an SPD for that color temperature. The chromaticity coordinates of a blackbody light source of a given temperature can be found by first using Planck’s Law and then calculating the tristimulus values from the equations found in the sidebar referecnced from part 1. The Planckian locus is the plot of chromaticity coordinates of blackbody radiators over the range of approximately 1000K to infinity. The color of a 1000K blackbody radiator is a deep red. Below 1000K there is negligible radiation in the visible spectrum. As the temperature rises the color shifts to orange, yellow, white and finally a bluish white.
where n = (x – 0.332)/(y – 0.1858)
Natural light sources are for the most part thermal sources and therefore are at least approximately blackbody radiators. The surface of the sun is also approximately a blackbody radiator, but the SPD of sunlight at the surface of the earth is modified by absorption and scattering of the atmosphere. The atmosphere scatters blue wavelengths predominantly which explains why the sky is blue. At noon sunlight passes through the least amount of the atmosphere while at sunrise and sunset sunlight passes through a significantly larger cross section of the atmosphere, removing most of the blue light. Consequently direct sunlight at sunset as well as clouds backlit by the setting sun, both turn to the deep reddish orange hues of a sunset. The SPD therefore of direct sunlight changes significantly throughout the day.
SPD of natural light
In the 1970s several color scientists collected extensive spectral data on sunlight throughout the day. They found that the chromaticity coordinates of the sun throughout the day and under different weather conditions fell along a curve just above the Planckian locus with a CCT ranging from just below 5000K to as high as 7000K. These data were used to build a model of sunlight by Judd, Wyszecki, and McAdam known as the series D illuminants. This model simulates the SPD of the sun over a wide range of CCTs. Fig. 5 shows the Series D curves at 5000K, 6000K and 7000K with the corresponding blackbody curves superimposed. Note that the curves closely follow each other overall, except at the blue end of the spectrum.
The invention of the light bulb was a great step forward, by making an artificial blackbody radiator by heating a filament to 2700°K by passing a current through the filament. The convenience and the quantity of light produced by incandescent bulbs was a huge technological leap forward that revolutionized both productivity in the workplace and the quality of leisure time.
Despite the fact that incandescent bulbs were a great technological improvement, they were inherently inefficient as illumination sources, because like all blackbody light sources that emit in the visible range, they also produce copious amounts of electromagnetic radiation outside the visible range, mostly in the infrared. Luminous efficiency of any light source is defined as the light output in lumens divided by the power supplied to the source. The light output is simply the SPD of the source multiplied wavelength by wavelength by the eye’s spectral response curve also called the Photopic Curve ,V(λ). Fig. 6 shows the SPD of an incandescent bulb with the V(λ) superimposed. This illustrates why an incandescent bulb is such an inefficient light source. Most of the energy radiating from an incandescent bulb is in the infrared region (> 700 nm) and is therefore invisible to the eye.
Even though our eyes are only sensitive to a narrow portion of the SPD of a blackbody radiator, the peak sensitivity of the eye is at 555 nm which is maximally tuned to sunlight with a CCT of 5050K. In fact recent research has even found that our circadian rhythm is synchronized to the changing color temperature of sunlight throughout the day. Consequently the ideal artificial light source for general illumination would have the spectral power distribution of a blackbody radiator that is tunable in color temperature throughout the day, but only emits in the visible range of approximately 400 nm to 700 nm to achieve high luminous efficiencies.
LEDs and narrowband light
LEDs are the first artificial light source that can meet this ideal. LEDs are inherently narrowband light sources. In fact, we have to add phosphors to them to make their spectrum sufficiently wide enough to cover the visible spectrum. The narrowband emission of LEDs though means that various colored LEDs and phosphors can be mixed together to make a light source with a tunable spectrum that is also optimally efficient because it does not waste power generating radiation outside the visible spectrum.
In upcoming issues of LEDs Magazine, we will discuss how to apply color science to design LED products that take advantage of this flexibility achieving both efficiency and light sources will superior color qualities.
More in this series
Understand color science to maximize success with LEDs
Understand color science to maximize success with LEDs - part 3
Understand color science to maximize success with LEDs – part 4
*Updated Nov. 2, 2020 for additional content links.


