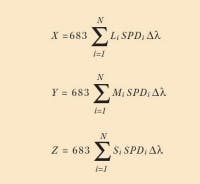
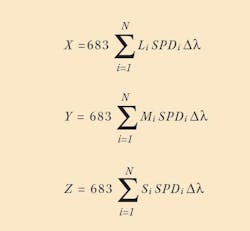
The color-matching functions of the primaries of a color space combined with the SPD of a light source, or reflected light, determine how the light is plotted in the CIE Chromaticity Diagram. To plot the x, y coordinates of a light source on the CIE Chromaticity Diagram, first calculate the X, Y, Z tristimulus values using the first three equations below.
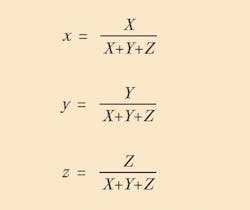
The CIE chromaticity coordinates are then derived from the tristimulus values using the following three equations.
While X, Y and Z increase with increasing brightness x, y and z are independent of brightness and thus only specify chromaticity. Further the last three equations above ensure that x + y + z = 1 so only two of x, y, or z are required to completely specify a color. The ubiquitous CIE Chromaticity Diagram shown in Fig. 7, plots the x and y color coordinates ignoring the z coordinate since it is redundant.


