Thus it has been necessary for users of encapsulating epoxy to perform their own series of tests on candidate materials. No doubt this is a good way to figure out the actual epoxy properties, however when dealing with a number of candidate epoxies this becomes a very time consuming procedure that can waste a substantial amount of resources. Hence, being able to predict the characteristics of the cured epoxy by reviewing the technical data sheet, or by performing a simple characterization procedure is extremely valuable in helping to reduce the design time to market for a product.
The properties of the epoxies, per supplier data sheets, are tabulated in Table 1 for reference. The thermal and mechanical properties of each of the epoxies were investigated using the same methodology for a conclusive comparison.
Properties to Characterize
1. Liquid epoxy properties: Gel time and peak exotherm
Differential scanning calorimetry (DSC) experiments were performed on the epoxies using the Perkin Elmer Pyris 6 DSC instrument to investigate their cure behaviors. In the two-part formulation, the components are mixed immediately before the encapsulating application occurs. The mix ratios recommended in the technical data sheets were used in this study. The DSC sample size was in the range of 16 mg to 18 mg, and the DSC scan was performed between +30 ºC and +300 ºC at a constant heating rate of 10 ºC/minute to investigate the gel time and peak exotherm.
2. Thermo-mechanical properties of epoxy without preconditioning
To obtain the thermal transition characteristics of these epoxies both prior to and after preconditioning at +85 ºC/60% relative humidity (MSL2), dynamic mechanical analysis (DMA) experiments were performed using a Perkin Elmer Pyris 7 DMA instrument operating in single cantilever beam mode. The DMA scan was performed between +30 ºC and +250 ºC at a constant heating rate of 5 ºC/min.
To obtain data on the dimensional change of these epoxies, thermo-mechanical analysis (TMA) was performed using the penetration mode and scan from +30 ºC to + 250 ºC at a constant heating rate of 5 ºC/min. A DSC scan was also performed to understand the change in thermal properties before and after preconditioning.
3. Effect of moisture on epoxy properties
The same samples were subjected to preconditioning at +85 ºC/60% RH for 168 hours, after which the tests in item 2 were conducted to compare the epoxy properties after moisture absorption.
4. Effect of oxidation (qualitative by visual inspection)
The cured epoxies slabs were subjected to baking at +165 ºC for 72 hours to compare their thermal stability. This represented an accelerated test for hot operating life test (HTOL) of +120 ºC/1000 hrs., based on the assumption that the reaction is doubled with every 10 ºC increase in temperature.
5. Adhesion strength between epoxy & PPA slab
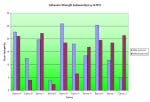
The epoxies were applied to polyphthalamide (PPA) slabs an cured, then were sheared with a shear jig (max. 20 kg) both without preconditioning and after preconditioning at +85 ºC/60% RH for 168 hrs. Note that the housings of the production LEDs are made of PPA, hence the adhesion strength between the epoxy and the lead frame (housing) is crucial for package robustness.
Results
A. Gel time and peak exotherm
High exotherms present several challenges for a packaging manufacturer because they lead to higher shrinkage and greater embedment stress. Thus, the epoxy system requires a delicate balance between gel time and peak exotherm. A lower peak exotherm (temperature/time) implies that the material is more reactive, which may relate to the functionality of the epoxy. As shown in Table 2, Epoxy G, Epoxy H, and Epoxy A demonstrate similar peak temperatures, onset temperatures and peak times. They have an average range of onset and peak exotherm as compared to other epoxies.
B. Thermo-mechanical properties of epoxy without preconditioning
Stress analysis without preconditioning
The total stress of the epoxy is calculated by using Equation (1):
S = Total stress
alpha(T) = Thermal expansion coefficient of epoxy
E(T) = Storage modulus of epoxy
T = Temperature
Prior to preconditioning Epoxy I had the lowest stress below its Tg/below +100 ºC. Average stress below 100 ºC was used for comparison, as this property is crucial to pass the temperature cycling (TMCL) test of 55 ºC to +100 ºC for Avago’s PLCC epoxy package. Furthermore, the recommended operating and storage temperature for Avago PLCC package (Part number HSMx-A100) is in the range of -55 ºC to +100 ºC.
C. Effect of moisture on epoxy properties
The effect of absorbed moisture on thermo-mechanical properties of epoxy was also studied. All epoxies are moisture sensitive, specifically on the hardener side. Raw materials in the hardener react with moisture and form free acid. Free acid will effect the cross link (reaction) between resin and hardener, resulting in a weaker cross link which leads to poor physical and electrical properties. Significant decrease was observed in the Tg of certain samples after moisture absorption, with the higher the moisture pickup, the greater the reduction in Tg. The moisture absorption for Epoxy G and Epoxy A is much lower than the other epoxies.
Table 4 summarizes the properties of the epoxies after preconditioning. Again, the data support that epoxy A is thermally, mechanically and dimensionally stable, as the Tg values from DSC, DMA and TMA testing are similar to each other.
Moisture absorption test
The moisture absorption of the epoxies was defined as percent weight gain after preconditioning. Ten samples were conditioned at +85 ºC/60% RH and removed from the chamber for weighing after 168 hours. Epoxy D, Epoxy C and Epoxy A show the highest resistance to moisture. In summary, Epoxy A and Epoxy G consistently show the best moisture resistance after reviewing both ΔTg and weight gain results.
D. Oxidation
The cured epoxy slabs were subjected to baking at +165 ºC for 72 hours to compare their thermal stability. Epoxy C , Epoxy D and Epoxy I showed the most oxidation based on the development of a yellowish color, whereas Epoxy G and Epoxy H showed a very slight color change.
E. Adhesion Strength
F. Stress Simulation
The fracture mechanics approach was used in the stress simulation model by applying a crack tip between the die attach and lead frame. The strain energy release rate (ERR) at the interfacial crack tip is calculated, which characterizes the propensity of crack propagation. The risk of crack propagation/delamination increases with the strain energy release rate.
Mode mixity (phase angle), y = tan-1(KII/KI)
Where:
KI = Stress intensity factor in tensile mode
KII = Stress intensity factor in Shear mode
Critical ERR decreases with mode mixity. It also indicates the dominance of the mode of fracture The risk of crack propagation/delamination is low when the strain energy release rate is low and y is high. Five out of the 10 types of epoxies were selected for stress simulation modeling samples in the PLCC2 LED package. The results were in line with the epoxy evaluation result ranking in comparison to the internal stress, moisture resistance and adhesion resistance of the epoxies.
Summary of epoxy characterization
- In the case of epoxy reactivity/ aggressiveness, the least aggressive epoxy was denoted as number 1 and most aggressive as number 10 . This data is included for reference only and was not taken into design consideration as it has no direct impact to the performance of the epoxy.
- The sample with the least weight gain after preconditioning, which translates into the most resistance to moisture, was denoted as number 1.
- The moisture resistance is defined as the minimum change in Tg after preconditioning. The least change in Tg and lowest stress is denoted as number 1.
- The oxidation resistance is defined as the least color change after baking. The least yellowed sample is denoted as number 1.
- The epoxy with the greatest adhesion strength to PPA was denoted as number 1.
Based on the findings of this study, Epoxy A demonstrates superior properties in all aspects. The degree of yellowing of this epoxy was acceptable as no severe UV degradation was reported in current PLCC packages in any of operating life tests.
Eight epoxies were subjected to additional stringent tests to further validate the observation. Epoxies I and J were eliminated from the additional tests, since epoxy J was the most susceptible to moisture, and epoxy I showed the most yellowing after baking, which will translate into high UV degradation in the package.
Reliability results
Reliability tests were performed over a temperature cycle of -55 ºC to +100 ºC, wet hot storage life test (WHSL), +85 ºC/85% RH; and wet hot operating life test (WHTOL) +85 ºC /85% RH. Epoxy A passed all tests, which agrees very well with the characterization results. Epoxy C displayed severe UV degradation, which is also in line with the characterization results.
Conclusions
A superior epoxy should have low stress, high resistance to moisture absorption, high resistance to oxidation, and high adhesion strength to PPA. Epoxy A exhibits superior performance in characterization evaluation, stress simulation and reliability. The results clearly showed that the characterization evaluations and simulation models provide promising correlation to the actual reliability performance.
Acknowledgments
The author would like to thank Margaret Tan Kheng Leng, Oon Siang Ling & Lee Kee Hon for providing the support and information needed to write this article.
References
W. J. SiChina, “Better Isothermal Cure Kinetics Studies Using Power Compensation DSC,” Perkin Elmer Instruments
W. J. SiChina, “Characterization of Epoxy Resin Using DSC,” Perkin Elmer Instruments


