In this excerpt from an upcoming reference book entitled Handbook of LED and SSL Metrology, GÜNTHER LESCHHORN and RICHARD YOUNG explain the fundamentals behind luminous flux and radiant power measurements - a task critical in solid-state lighting (SSL) product development.
Typically luminous flux and radiant power are the most important optical parameters for LEDs although the spatial intensity distribution is sometimes also required. For smaller devices averaged LED intensity in condition B is still common. Partial LED flux is a quantity that is growing in acceptance but still not widely measured. For SSL sources, the photometric and colorimetric radiation characteristics are important.
Interested in articles & announcements on LED & SSL product testing/metrology?
The two principal methods for measuring total radiant power and luminous flux are using either an integrating sphere or a goniophotometer/goniospectroradiometer. The next two sections explain these two measuring methods with consideration of typical measurement challenges.
The integrating sphere method and measuring geometries
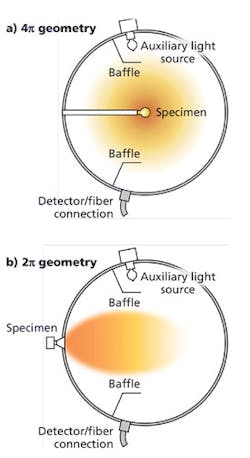
The luminous flux quantity is sometimes called total luminous flux to emphasize the fact that it is the total for all directions. It is also referred to as 4π flux since a complete sphere has 4π steradians of solid angle. To collect all light within the 4π steradians the source needs to be at the center of the sphere. This 4π geometry is the conventional configuration for measuring luminous flux (see Fig. 1a). The radiation emitted in all directions is captured and the total luminous flux is measured.
For light sources which have negligible or no radiation directed backwards, the total flux can be measured in the more convenient forward flux, or 2π geometry. Here, the light source is located at a port in the wall of the sphere. Only the light radiation emitted in the front hemisphere is recorded for the measurement (see Fig. 1b). This forward radiation is typical for most LED products. The integrating sphere must be calibrated absolutely based on the measuring geometry in conformity with the substitution principle. This principle states that the test light source should always be measured by comparison to a standard source having similar spatial and spectral distributions.
Guidelines for selecting the correct size
The test specimen should always be significantly smaller than the internal diameter of the sphere, in order to keep the interference factor caused by the sample itself as low as possible. However, the incident light intensity on the detector decreases as the sphere gets bigger. As a rule of thumb, the light throughput of an integrating sphere is a function of the inverse square of the sphere's radius. Selecting the correct relationship between the size of the test object and the size of the sphere is therefore crucial for an effective balance between high measuring quality and good throughput (see also Fig. 2).
There are guidelines for selecting the correct size of a sphere for a given size of the test sample. Using the 4π geometry, the total surface of the test sample should be smaller than 2% of the surface of the sphere. The length of a linear lamp should be less than 2/3 of the diameter of the sphere. Using the 2π geometry, the diameter of the measuring port and hence the maximum extension of the test specimen should not exceed 1/3 of the sphere diameter.
FIG. 1. CIE recommended sphere geometries for all sources (a) and for sources with no backward emission (b).
Self-absorption correction
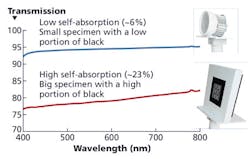
The test object itself contributes to the absorption of light radiation in the integrating sphere. This form of interference known as self-absorption can result in a significant attenuation of light radiation and leads to deviations in measurement. This attenuation becomes more pronounced as the test specimen becomes bigger and darker. Fig. 3 shows two typical examples of test specimen and the resulting transmission versus wavelength. Self-absorption can lead to a correction up to several ten percent.
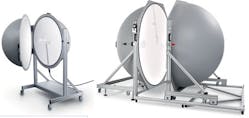
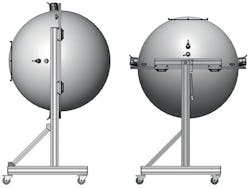
FIG. 2. A 1m-diameter sphere (left) is ideal for measuring most LEDs and modules in the 4π and 2π recommended geometries. A 2m sphere (right) is ideal for large luminaires and SSL products.
A self-absorption correction with the assistance of a suitable auxiliary light source is therefore essential for precise measurements. A halogen lamp covering a wide spectral range is typically used for this purpose. The auxiliary light source must be positioned behind a baffle in order to avoid illuminating the sample directly and it should be operated by a stable power supply. This light source is used to determine the spectral absorption behavior of the device under test, the sample holder and the connecting cables, and then offset with the actual measurement. The effect of self-absorption increases as the reflectance of the coating rises and the ratio of the area of the sphere to the test specimen decreases.
Near-field absorption
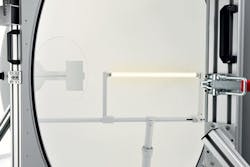
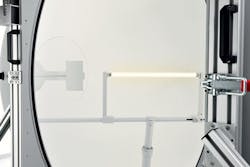
Any object (such as a socket for example) that is in close proximity of the light source absorbs light significantly and may cause large errors. This so-called near-field absorption cannot be corrected by a self-absorption measurement. The cause of this effect should thus be avoided. The object should be placed as far away from the lamp as possible and the formation of cavities should be avoided. In addition, coating of the object surface with a high-reflectance material is recommended. As an example a good solution of a linear tube holder is shown in Fig. 4.
FIG. 3. Self-absorption spectra for two typical DUTs (devices under test).
Burning position
As described in another chapter of the book, measurements of passively cooled SSL sources should be performed in the burning position defined by the manufacturer. This also applies to sphere photometry. When measuring in the 4π geometry, it is convenient to use an internal lamp post that can be mounted up-down or down-up, to realize the designed burning position of the light source. In the case of 2π geometry, a rotatable sphere is the method of choice (see for example Fig. 5). The complete sphere can be rotated within its mounting frame. The measuring port is therefore located at the side, top or bottom side.
Consideration of measurement errors
Contributions to measurement errors are manifold. An error analysis when using a spectroradiometer as detector can be found in another chapter of the book. The wide range of radiation characteristics shown by LEDs can introduce calibration errors in measuring luminous flux. A variation of 5% can be obtained for components with diffuse emission, but deviations of more than 10% are possible with narrow-angled LEDs.
As described above, selecting the right sphere size, performing a self-absorption correction, avoiding near-field absorption and measuring in the designed burning position of the light source is crucial for a high accuracy measurement.
FIG. 4. Example of avoiding near-field absorption effects. The holder of the linear tube is placed as far away as possible from the light source and coated with a high-reflectance material.
Another big portion of error contributes when starting the measurement before the source is thermally stable. Furthermore, when testing according to CIE S 025 or EN 13032-4, an ambient temperature of 25°C is recommended. Putting a source which generates heat into an enclosure (the integrating sphere) the ambient temperature (temperature in the sphere) will rise and it will be different to the "normal" operating conditions. When measuring in the 4π configuration, it is therefore recommended to stabilize the source with the sphere hemispheres open. The sphere should be closed just before the measurement. This way, ambient conditions in normal operation can be simulated best. Care should be taken to close the sphere in a subtle manner in order to avoid air movement which might contribute in an undesired way to thermal management.
The goniophotometer method
Although measuring luminous flux or radiant power with a goniophotometer is more time-consuming compared to using integrating spheres, it is much more precise. This measuring procedure does not require luminous flux standard lamps as a reference value as it is the case in sphere photometry. It is the method of choice if lamps with different luminous intensity distributions have to be measured and it is the baseline for calibrating luminous flux standard lamps which provide the reference value for other test procedures. Another distinguishing feature of goniophotometry compared to sphere photometry is the capability to measure partial luminous flux and angle of half intensity. These values need to be determined when measuring characteristics relating to energy efficiency and conformity to Zhaga specifications.
The method can be best described by an imaginary sphere enclosing the LED. A cosine-corrected detector moves on the surface of the sphere along specific paths at distance r (the sphere radius). The detector is used to determine irradiance E arising as a result of the partial radiant flux dΦ incident on detector area dA as a function of θ and φ.
In order to determine total radiant power, the detector is moved incrementally in angle θ. Several measurements are taken for each angle θ with angle φ varying from 0° to 360°. Individual zones are scanned corresponding to a constant degree of latitude of the sphere. Total radiant power Φ is then
Alternatively, instead of moving the detector which might require considerable mechanical effort, a stationary detector can be used and the LED is scanned about its tip. However, for modules and luminaires that have convection cooling this may not apply and a correction for the luminaire position might be indicated.
FIG. 5. A rotatable 1m sphere. Position-sensitive light sources can be measured in their designed operating position.
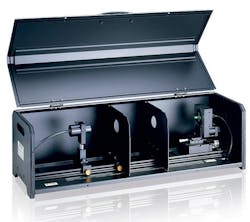
Fig. 6 shows the setup for this kind of LED goniophotometer. The angle φ is adjusted by rotating the LED about its mechanical axis and angle θ by pivoting about its tip. The detector sits on an optical rail to permit measurements at various distances.
FIG. 6. Goniospectroradiometer with a compact light shielding enclosure. The LED is moved instead of the detector. The angle φ is adjusted by rotating the LED about its mechanical axis and angle θ by pivoting about its tip.
Large distances are a requirement for luminous intensity distribution to meet the far-field condition. For measurements of total flux using a goniometer, the large distances are not required. Providing the detector has good cosine response the irradiance can be measured accurately at all angles. Irradiance is not a property of the lamp but is instead the light falling onto a surface. By measuring the irradiance at sufficient locations around a virtual sphere enclosing the lamp, the total flux can be derived by integration. Providing that no interactions between source and detector occur, the size of the source can be almost the size of the virtual sphere.
Efficiency and efficacy
If the total optical power emitted by a LED, module or luminaire is known then it can be combined with electrical power P [W or watts] supplied to the unit to give efficiency:
Efficiency is unit-less (the units in the numerator and denominator cancel) and specific to the conditions of measurement. Driver efficiency may be included or excluded and temperature de-rating to operational conditions may be required for practical applications.
Luminous efficacy is similarly calculated but using total luminous flux:
Luminous efficacy is expressed in units of lm/W. Like efficiency, luminous efficacy values are specific to measurement conditions and may include or exclude driver efficiencies and temperature effects.
ACKNOWLEDGMENT
This text is excerpted from Handbook of LED and SSL Metrology, to be published by Instrument Systems end of 2016. Figure references have been modified from the original for clarity.
GÜNTHER LESCHHORNis head of product management at Instrument Systems (instrumentsystems.com).RICHARD YOUNGrecently retired from his role of chief scientist and is now working as a consultant for Instrument Systems.
