Indeed, the excitement - even hype - about the potential of power LEDs to revolutionise the lighting industry has been joined by scepticism among some lighting designers and architects. This is likely the result of the failure of some early solid state lighting solutions to live up to their promises in terms of light output, efficiency or operating lifetime. In many cases, assumptions that the performance of an LED as stated on a datasheet would translate directly to that level of performance in a luminaire. In fact, this is never the case and the performance numbers quoted by LED manufacturers are not the same as what will be realized in an application that functions in a completely different environment.
As this article will show, there is no alternative for the lighting equipment manufacturer to a rigorous examination of the relevant data in the datasheet. This analysis will uncover the actual performance and lifetime of a power LED under the conditions that will apply in the luminaire’s operating environment.
Why all LEDs are not born equal
A 60W GLS light bulb is a standard, commodity product. Power LEDs, by contrast, are not commodities that adhere to a single industry standard. Even if power LEDs from different vendors shared identical packaging and pinout (which few do), differences in performance would mean that one brand could not be simply interchanged with another.
There are a number of reasons why LED manufacturers’ products differ considerably. Solid-state lighting is a young and developing industry, and innovations are constantly being introduced by manufacturers to improve performance characteristics and to give their products a competitive edge.
Some of the factors that result in product differentiation are:
- The design, manufacture and materials used to create the LED.
- Phosphor development. Different phosphors react differently to heat and to light.
- LED packaging can affect how light exits the package, how much heat can be dissipated and how optics are attached.
This is important to understand, as superficial descriptions of power LEDs can give the impression of a standard output analogous to the standard wattage label applied to GLS bulbs. When two different LED manufacturers describe parts as providing ‘min. 100lm at 350mA’, it is true that, in certain tightly defined circumstances, including but not limited to an input current of 350mA, both power LEDs will produce at least 100lm.
But change those circumstances even a little and the performance of the two LEDs can begin to diverge significantly. The two potentially conflicting key parameters that affect the performance of an LED are:
- drive current – up to a certain threshold, the higher the current applied to an LED, the more light it will produce and the hotter it will get.
- operating temperature, the hotter an LED gets, the less light it will produce.
No matter which brand of LED a lighting manufacturer uses, luminaire design decisions for drive current and thermal management will entail trade-offs. For instance, a decision to choose a high drive current for higher light output could cut the number of LEDs required to hit the target for light output, which will have a helpful impact on BOM cost. But there will be a trade-off in terms of lower efficacy for the LED and higher operating temperature.
All brands of LED will be subject to these trade-offs. But the size of their effect – the amount of pain they inflict, if you will – is very different from one brand of LED to another. This is where the factors described earlier – differences in in LED design and manufacturing – show their impact.
The fact that stark differences in performance between one LED and another will emerge once they are embedded in a real luminaire is very far from obvious from the first page of a power LED’s datasheet. But the tools to make an informed choice do exist in the datasheet. The designer simply needs to know how best to find and use them.
Worked example
This is perhaps best illustrated by example. For our example we will calculate for a simple, single LED desk lamp, in order to make the figures as easy to follow as possible. But the principles and methods shown here can be applied to any solid-state lighting design in any application.
So let us imagine that you are the lead project engineer at a lighting equipment manufacturer, and you have to work to the following brief. You are to design a desk lamp with the highest possible light output. The lamp must be capable of producing light output after 50,000 hours of operation at a level that is at least 70% of output when the lamp was new.
A key part of this design project will be to choose an appropriate brand of power LED as the light source. The first stage in evaluating LEDs is to compare the raw light output figure as shown at the front of the datasheet issued by the manufacturer. Since the application is a desk lamp, space for mounting LEDs in the lamp will be constrained.
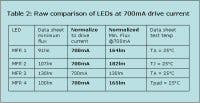
This data does not allow a like-for-like comparison, as the MFR 3 part is specified at 700mA. This explains the much higher light output value. Interestingly, different manufacturers adopt a different approach to specifying the temperature at which the device was tested, and this gives further scope for confusion. The effect of such differences emerges quite clearly as we progress further into the evaluation.
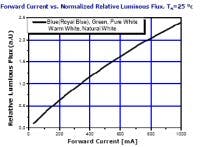
For three of the parts, this means applying the Flux Normalisation graph found in each datasheet (see Figure 1 for a typical example). The graph will provide a factor to use for each specific LED to calculate the light output produced at the higher current.
So how do we calculate the actual light output we will get at the operating temperatures our desk lamp will experience in real life? For this we need the Temperature De-rating graph provided in every manufacturer’s datasheet. First, we must specify the conditions in which our LEDs will operate: the ambient temperature (in degrees Centigrade); and the thermal performance of the luminaire, expressed as a value for thermal resistance. Thermal performance will be strongly affected by any thermal management methods applied, such as heat-sinking.
The first interesting point to note is that the MFR 3 part cannot be used at all under these conditions: the high ambient temperature drives the temperature at the LED up to 141°C, 16°C above its maximum rated value.
Also interesting is the rate at which the output from the MFR 1 part declines under these conditions, when the LED’s temperature rises to 135°C: while the part boasted an impressive 164lm output at 700mA before taking operating temperature into account, in real conditions it produces 118lm, markedly less than the two remaining emitters.
We now have a much more realistic basis for comparing different brands of LED. But we still have not taken into account at all the requirement for 70% lumen maintenance after 50,000 hours.
Again, all datasheets provide lumen maintenance graphs showing the rate at which light output declines over time.
But it is important to look carefully at the operating conditions that apply to valid data sets (see Table 4). For the MFR 4 emitter, these operating conditions are consistent with the lumen maintenance graph’s conditions: the device is able to provide 50,000 hours of use at a junction temperature of 135°C; in the desk lamp example, the LED will actually run at 130°C. So we now know that the MFR 4 LED will produce 133lm when new, and will still provide at least 70% of peak output after 50,000 hours.
But in our example, when driving LEDs at 700mA for high light output, the MFR 2 device runs at a much higher 128°C. The simplest way to compare the MFR 2 emitter with the others in our example while achieving a 50,000-hour lifetime is to lower the drive current to a value at which junction temperature is 85°C. To achieve this, current must be reduced to 407mA, and at this low current the LED only produces 107lm, versus the 133lm from the MFR 4 LED at the full 700mA. Additionally LED drivers are typically available for 350 mA or 700 mA. Since 407 mA is not standard, a customer solution would likely have to be created which could add cost to the solution.
This is not the only approach that can be taken. Other options include:
- easing the specification, either by reducing the product’s lifespan to less than 50,000 hours or reducing the lumen maintenance requirement to less than 70%
- improving the thermal management of the device, perhaps by increasing the heat-dissipation capability of the heatsink
Conclusion
The conditions that apply in the raw statements of performance shown in Table 1 and typical of LED datasheets are very different from those that apply in real luminaires. When all operating conditions are taken into account – a realistic drive current for those applications that need bright light, the real temperature at which the device will operate, and compliance with lumen maintenance requirements – the actual light output, and the comparison between different brands of LED, look very different. Only through analysis of the LED performance metrics based on the actual application and intended environment can an appropriate selection decision be made.


