Binning remains a required step in the production of LEDs, and MATTHIAS HOEH describes a methodology that can improve the precision of binning operations, which in turn can help SSL product developers deliver consistent color and flux output.
LEDs for sophisticated applications are marketed in classes with tight colorimetric and photometric specifications with the classes commonly being known as bins. Solid-state lighting (SSL) product developers rely on the binning process to specify LEDs to thereby deliver lamps and luminaires with consistent color and light output. Binning is a costly and time-consuming but necessary burden for LED manufacturers. Let's consider a binning methodology that can lead to optimal classification.
Indeed, the necessary quality for LEDs and, in turn, SSL products can only be achieved by using accurate and high-precision measurement and classification during production. Instrument Systems has analyzed methodological optimization alongside improvements to instrumentation and has developed a guideline for LED manufacturers to improve binning precision in LED production. Specifically, we will describe how to eliminate the impact of rapid fluctuations and slow drift in LEDs.
Comparability and reproducibility of measurements
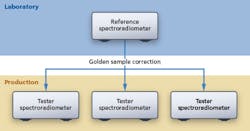
The optical characteristics of an LED (or generally of a device under test; DUT) are determined at a handling and sorting system, called a handler, in the production process using an integrated electrical and optical tester. Fine adjustment of the optical measured values is carried out using one or more reference light sources that are known as golden samples. Such reference sources have been measured accurately and precisely in a reference laboratory.
Color binning is then carried out on the following basis. The DUT is allocated to a class and mechanically sorted to a bin with DUTs of the same class for subsequent sale. Each tester must be stable enough to maintain the desired binning specification until the next correction to the laboratory reference values, i.e., the statistical and systematic measuring errors must be sufficiently low. All other test stations in the production line must be referenced to the same or comparable laboratory values (Fig. 1). If there is more than one production site, the laboratory reference values must in turn be aligned to each other and adjusted if necessary.
The comparability of the color binning results at several production sites is a higher-level problem and can be achieved with an overarching metrology concept. Highly accurate and precise optical measurement in reference laboratories is a basic requirement for any comparability and this can be guaranteed with established procedures for LED laboratory measurement. However, the core problem of optical test and measurement on a production line has not really been addressed in the literature - specifically how reproducible measured values can be achieved for binning within a correction interval, within a calibration interval, and within the production site. This leads to the issue of how rapid fluctuations and slow drift effects can be prevented and where there are feasible boundaries for commonly applied correction functions.
The causes of general perturbance phenomena were analyzed on the basis of theoretical and experimental approaches and countermeasures were specified in order to provide answers to the issues outlined previously. The result is a guideline for methods and equipment in LED production. It allows comparability to be significantly enhanced within a bin group and between bin groups that are produced subsequently and in parallel.
Improvement of binning precision
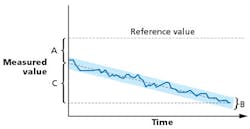
Ultimately, inaccurate as well as imprecise measurements mean that DUTs are sorted to the wrong bins. The initial step in the investigation is to divide the problem into three phenomenological classes, which are shown in Fig. 2 in order to draw conclusions about the underlying technological and methodological causes.
A. Initial mean deviation from the laboratory reference. There may be many reasons for a measurement deviating from the reference value and its individual contribution is generally not known. The empirical "correction" for the deviation therefore inevitably increases the level of measuring uncertainty. In the practical setting of LED production, the correction is commonly determined from a linear fit with two free parameters. From a metrological perspective, this is justifiable for small deviations between measured value and reference value. However, this approach will often be unsuccessful for large deviations, especially if one cause for the deviation dominates.
The deviation should be kept as small as possible in order to avoid corrections entirely or to at least minimize the impact of potential erroneous corrections. In other words, the measurement of a DUT in production must be "virtually correct" right from the start. The following two examples deal with the most important causes of the phenomenon described.
Influence of measurement conditions
In order to provide a concrete example, this section assumes an LED with an emission cone of 130°. An integrating sphere with a diameter of 100 mm is used to determine the color coordinates and luminous flux. As is normally the case in a production setting, the DUT is positioned a few millimeters in front of the entrance port of the sphere since this can be realized with a single mechanical axis.
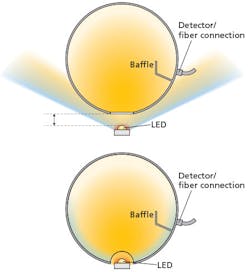
For a distance of 10 mm between the LED and sphere, only the light emitted within a cone of 118° enters the integrating sphere. Light emitted to the side, which is not collected by the integrating sphere, needs to be compensated by the correction function. This can only succeed if emission to the side is proportional to perpendicular emission, but this does not apply in practice. If the phosphor layer on the sides of the LED is damaged or varies in thickness, the resulting red or blue shift of the entire emission is not taken into account by the correction (Fig. 3a). Errors also result if the orientation of the optical axis or the opening angle of the emission cone varies from one LED device to another.
This problem can only be rectified by measuring the total luminous flux. The minimum requirement for conforming to this ideal is achieving the smallest distance possible between the entrance port of the integrating sphere and the DUT. A further improvement can be obtained by automated positioning of the DUT directly inside the entrance port in what is called a 2π geometry. Integrating spheres optimized for LED production can be supplied for this type of test setup. They are equipped with a glass dome to provide protection against dust. This enables the LED to be positioned directly within the radius of the sphere using a special handler without the dust being able to penetrate into the sensitive measurement adapter (Fig. 3b).
Technical and cost boundaries limit the standardization of measurement conditions in a production setting to the recommendations for laboratories. Those recommendations are defined in some international standards on the uncertainty of measurements and calibration.
If the remaining discrepancy is to be further reduced, it is also necessary to harmonize measurement conditions in the reference laboratories with subsequent conditions in production facilities. This avoids other deviations that cannot be corrected empirically. For example, the 4π geometry recommended for laboratory-based measurement of luminous flux and color coordinates is not practical in production environments. This geometry involves the DUT being positioned in the middle of an integrating sphere. The calibration of all measuring systems should therefore be designed for subsequent measurement in 2π geometry.
Influence of calibration
The importance of an accurate absolute measurement for a reproducible binning result was demonstrated in the previous section relating to the measurement conditions. Moreover, wrong calibration of optical measuring instruments (typically CCD-array spectrometers) on the production line causes deterioration in reproducibility. If calibration is impaired or inaccurate, a large correction of the measured values is necessary in order to obtain the laboratory reference value. However, the validity of the empirically determined correction function depends in each case on the causes of the deviation and the spread of the optical characteristics of the tested devices. Results following a correction are therefore generally of doubtful value.
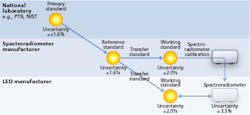
Calibration must satisfy strict conditions in order to minimize the uncertainty outlined above. If this is to be achieved, calibration should be retraceable to reliable reference standards - in this case, light sources - as maintained by national laboratories such as NIST (National Institute of Standards and Technology) or PTB (Germany's national metrology institute) as illustrated in Fig. 4.
Appropriately equipped calibration laboratories staffed by trained personnel are necessary for carrying out calibration. The calibration needs to be repeated in order to maintain high accuracy over the long term especially considering that system components may have undergone changes as a result of unavoidable aging effects. This can be ensured by monitoring with a working standard maintained in local laboratories as a reference (Fig. 5). If no reference is available, a recalibration should take place at maximum intervals of one year. One way of ensuring the quality of calibration is accreditation of an in-house calibration laboratory or a calibration service provider in conformity with the ISO 17025 international standard (linked previously).
B. Rapid fluctuations. Now let's discuss the rapid fluctuations issue (as seen in Fig. 2). Dynamic fluctuations of measured values are noticed on a time scale of milliseconds to seconds and they lead to poor repeatability. Repeatability is the standard deviation of a set of results from a measurement repeated under steady test conditions. The test conditions determine the result. These should therefore be taken into account when instruments are compared on the basis of repeatability specifications as documented in a standard on the uncertainty of measurements.
Repeatability exerts a major impact on how tightly, for example, the color coordinate boundaries for bins can be reasonably defined. If the boundaries are too tight for the repeatability achieved, LEDs with identical optical properties will often be binned differently. A highly precise measurement for excellent repeatability is essential in order to meet the market trend toward bins that match only one to two McAdam ellipses.
An averaging procedure cannot be used to increase precision because this wastes valuable time and it would reduce throughput in production. The only solution to this issue is the use of measuring instruments with outstanding repeatability. We analyzed two important physical causes for dynamic fluctuations of measured values in order to identify the basic requirements for high-precision measurement in LED production.
Impact of thermal noise
A measuring instrument is always subject to underlying background noise. If the noise is significant in relation to the actual signal, the precision and accuracy deteriorate. The problem can be addressed on the instrument side with a number of measures, which we intend to describe using the example of spectroradiometers for LED production. An initial measure is to use an inherently low-noise detector and low-noise signal-processing electronics. The unavoidable residual thermal noise can be further reduced by active cooling of the detector; our experience indicates that the temperature should be cooled to below -5°C (Fig. 6).
On the operator side, the relative noise level can be minimized by maximizing the signal at the detector. The saturation must be adjusted to accommodate the nominal spread of DUT emission properties without incurring oversaturation. Since the integration time of the spectroradiometer needs to be kept as low as possible in order to enable the highest throughput in production, only two adjustment options are available for detector saturation: the density filter in the spectroradiometer and the measurement accessories - for example, the size of the integrating sphere used. The combination of a suitable measuring instrument with measures undertaken by the operator will already achieve lower noise and more precise measurement, as well as facilitating binning in a more finely nuanced way on the basis of photometric and colorimetric quantities.
Impact of mechanical perturbation
The light emission of the DUT is collected by a measuring adapter and coupled into an optical fiber that transports the light signal to a spectroradiometer. An optical fiber has characteristic light-guiding properties that have to be incorporated in the instrument calibration. However, these properties change when the position of the fiber changes so unavoidable movements and vibrations of the handler alter the throughput and spectrum of the light signal. They therefore cause fluctuations of the measured values.
The technical approaches that make light transmission more independent of the fiber position are beyond the scope of this article. In practice, a fiber bundle is often used instead of an individual fiber. In combination with additional design measures, this eliminates sensitivity to movements and vibrations of the machine. These are the only types of fiber that should be used.
C. Slow drift. Even when optical measuring results obtained on the production line are corrected to the results of the spectroradiometer in the reference laboratory on a daily basis, agreement over an entire day is not stable enough for highly reproducible binning. The systematic errors of the spectroradiometer on a production line change over a timescale of minutes and hours so the measurement results drift in relation to the reference value.
The causes can generally be found in the measuring instrument and the actual test setup. Since more frequent correction is expensive due to test-system downtimes and strong drift effects ultimately render the calibration of the spectroradiometer questionable, this perturbation should be prevented by selecting suitable measuring instruments. The two biggest causes of drift effects are explained further on.
Temperature dependence of detectors and electronics
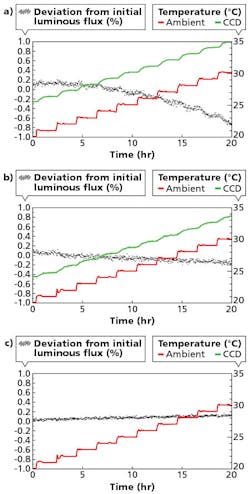
The link between noise and temperature of the CCD detector and the signal-processing electronics in an array spectroradiometer has already been addressed in the section on rapid fluctuations. The background noise is not only characterized by its amplitudes and frequencies but also by a temperature-dependent offset. The temperature of the components is determined by the operating status of the instrument in the first instance and by the ambient temperature in the second instance. The temperature-dependent offset leads to a change in the binning result over a period of a few hours so that classification by different instruments and at different times is not comparable (Fig. 6a).
The size of the error depends mainly on the design of the detector and the electronics. Accordingly, it can be considerably reduced by selecting an instrument with components optimized to that end (Fig. 6b). A correction algorithm specific to the instrument can additionally be used by the instrument manufacturer in order to reduce the remaining effect computationally. The effect can be almost entirely eliminated with temperature stabilization of the detector, which can be conveniently combined with active cooling for noise suppression in practical settings (Fig. 6c).
Countermeasures to improve LED binning
Causes of initial mean deviation | Countermeasure |
Incorrect calibration | Calibration procedure in conformity with ISO 17025 |
Obsolete calibration | Monitoring based on LED standards for timely recalibration |
Measuring conditions not optimum | Alignment of the measuring conditions in the laboratory and in production, based on CIE recommendations (e.g., 2π geometry) |
Stray light | Good optical design of the spectroradiometer (stray light for LED <0.05%) |
Low dynamic measuring range | Detector with deep quantum well (for dynamic range of at least 1000:1) |
Causes of rapid fluctuations | |
Thermal noise | Low-noise detector including signal processing electronics. Ideally, also additional active cooling (<-5°C). |
Quantization noise | Sufficiently small digitization steps (for typical measuring range around 15 bit) |
Signal too low | High signal level of the detector (without oversaturation), adjustment, e.g., via density filter |
Fluctuations in power supply to the DUT | Power source with good mains filter and long measuring times (NPLC 0.1 to 1) in the case of low currents (μA range) |
Light guidance influenced by fiber movement | Special fiber, optimized to constant throughput in spectral and absolute terms |
Different positioning with the handler | Positioning of the DUT should be precise |
Causes for slow drift | |
Temperature dependence of the detector and signal processing electronics | Detector and signal processing electronics optimized for low temperature dependency. Ideally, additional temperature stabilization |
Mechanical deformation of optical components | Responsibility of the tester manufacturer: Quality assurance for materials, precision in assembly and adjustment, quality control Responsibility of the LED manufacturer: Reduction of temperature fluctuations in production (±<3°C) |
Aging of optically relevant materials | Responsibility of the tester manufacturer: Use of high-quality components Responsibility of the LED manufacturer: Carry out regular corrections, monitoring with LED standards, as necessary renewal of barium sulfate coatings |
Impact of mechanical deformations of components
The components within the optical path of a spectroradiometer are aligned with exceptional precision and exert a big influence on the signal at the detector. If the optical path changes as a result of mechanical deformations, large systematic errors will occur. Deformations can be caused by unsuitable materials, components not properly fixed in position, deformation due to temperature, or material fatigue. In particular, temperature changes and vibrations create drift effects within minutes and hours.
The influence of this group of causes can easily be underestimated, but if spectroradiometers of inferior quality are used these effects lead to poor correlation of binning results between production lines and within a single line. There is a range of different methods to combat this problem and most of them are the responsibility of the instrument manufacturer. The measures include the use of appropriate and tested materials, manual adjustment of the instruments by trained personnel, and ensuring high quality throughout the production chain. LED manufacturers are able to make a comparatively small contribution to improvement by ensuring that the ambient temperature in the production area is controlled within a range of maximally ±3°C. If the spectroradiometer in question meets the quality requirements referred to above, the unavoidable vibrations of the handler do not present a problem for test and measurement.
Summary and outlook for color-binning test systems
The accuracy and precision of spectroradiometer-based test systems for LED production are closely linked to the comparability of parallel production lines and to short- and medium-term repeatability. Three phenomena impact negatively on this so-called binning precision:
• The mean deviation from the laboratory reference value that is to be corrected, i.e., the accuracy of the measuring system
• Rapid fluctuations
• Slow drift
Each phenomenon can be traced back to various physical causes. The countermeasures to improve LED binning are set out in the table above and some of these measures were dealt with in detail in the previous sections of this article. These measures relate to manufacturers of optical measuring instruments and the operators of the production plant.
The use of high-quality tools such as spectroradiometers and a detailed understanding of where accuracy and precision are important in LED production are the enablers for precise binning within tight photometric and colorimetric boundaries; they also provide good comparability over the long term.
MATTHIAS HOEH is product manager at Instrument Systems GmbH (instrumentsystems.com).
