This article was published in the April 2013 issue of LEDs Magazine.
View the Table of Contents and download the PDF file of the complete April 2013 issue, or view the E-zine version in your browser.
+++++
The first half of this article will provide a brief introduction to the basic principles of color-mixing theory and use them to illustrate why the 3:6:1 mixing ratio traditionally used in broadcast TV systems produces less satisfactory results when applied to solid-state signage and displays. A simple method for calculating the values required to perform accurate RGB mixing in LED systems is presented in the second half of the article.
Color mixing and the origin of 3:6:1
Color mixing evolved from an art into a science around the turn of the 20th century with the emergence of high-speed printing technologies that required accurate, repeatable color reproduction from a limited number of inks or dyes. A few decades later, it evolved again to meet the needs of modern lighting design and once again to produce color-accurate images using the red, green and blue (RGB) phosphor dots found in CRTs used in TVs and displays. One of the primary influences in this effort was the National Television Standards Committee (NTSC), which was established by the United States Federal Communications Commission to assist in the development of an analog television system by 1940.
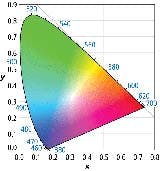
The CIE 1931 xy color space chromaticity diagram (CIE 1931 2°) in Fig. 2 is a two-dimensional figure derived from the three-dimensional CIE xyz color space. This simplified model is a useful tool for color matching as well as understanding other relationships between two or more colors (see www.ledsmagazine.com/features/10/2/11 for more information on color spaces and color matching). The 2D chromaticity space’s outer boundary curve is formed by spectral (monochromatic) points with respective wavelengths noted in nanometers. The straight line on the bottom of the space is called “the line of purples” because it describes the eye’s response to a continuum of ratios between red and blue. This color system was the first to describe the perception and reproduction of colors in a quantifiable manner and is still considered to be a so-called golden standard by engineers.
D65 target white
The commonly used 3:6:1 RGB mixing ratio is derived from this early research, created as a tool to produce a specific white point using the CRT phosphor’s predetermined colorimetric parameters. Note that the actual 3:6:1 mix was the result of CIE action in 1964 when the standards body recommended D65 as the primary standard for a daylight illuminant. This action foreshadowed the origin of the 3:6:1 RGB mixing ratio, which occurred when the D65 illuminant was subsequently adopted by NTSC.
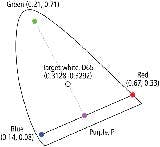
Fig. 3 shows the coordinates of respective red, green, and blue phosphors or emitters, and the D65 target white illuminant plotted in the CIE 1931 diagram. The mixing ratio required to produce the target color from the primary sources is achieved by calculating the relative distance within the color space between the coordinates of the phosphors, or emitters in the case of LEDs, and the target color. By convention, the resulting values are then normalized with respect to the blue source to simplify subsequent calculations.
3:6:1 may not apply to LEDs
Unlike the standard phosphors used in TV CRTs in the past, the red, blue, and green emitters used in modern lighting systems have spectral characteristics (i.e., they occupy different chromaticity coordinates in the color space) that, in most cases, do not match those of the corresponding phosphors used in TV applications. The LEDs’ spectral characteristics are primarily determined by their junction structure with emissions tuned to a primary wavelength during the manufacturing process. The output of green LEDs, for example, can range from 520 nm to 540 nm, with the dominant wavelength of a particular device producing its own unique set of chromaticity coordinates. This in turn affects the RGB ratio required to accurately produce white or any other color through the additive process.
Table 1 illustrates how the RGB mixing ratio required to reproduce a target white point varies according to the chromaticity coordinates of the primary color emitters being used. In this example, the two sets of RGB LEDs have identical red and green emitter characteristics, but their blue emitters have different dominant wavelengths (465 nm and 476 nm, respectively). It becomes evident that changing even one LED’s dominant wavelength results in dramatic changes in the value of the RGB mixing ratio required to match the D65 target white point. The LED set with the 476-nm blue emitter will require a 2.1:4.3:1.0 RGB mixing ratio but simply changing to a 465-nm emitter shifts it to 4.1:10.6:1.
From these results, it is apparent that if the standard 3:6:1 mixing ratio were applied to most LED sources, the color they produced would be noticeably different from the D65 broadcast standard white point or any other white point a customer might prefer. In addition, any other colors the display attempted to produce in reference to the erroneous white point would also be similarly distorted.
Calculating LED drive currents
In order to produce a true white value and achieve accurate color rendering in solid-state displays, the drive currents for their LEDs must be derived using a new RGB mixing ratio which is re-calculated from the chromaticity coordinates of the actual LEDs used in the sign and its desired target white point. The RGB mixing ratio can still be derived in the same manner as done with CRT-based displays. In many cases (including this exercise), the values can be derived using engineering tables or available software applications. Should neither of these tools be available, the proper RGB mixing ratio can be derived as detailed in the sidebar.
Once the RGB mixing ratio is derived for a particular set of LEDs and the target white point illuminant, we can determine the drive current that must be applied to the red, green, and blue emitters to produce the resultant white that is similar to the target white point. For the purposes of this exercise, we will assume an RGB LED display desired target luminance of 8000 cd/m2 with a pixel pitch of 12.5 mm. The procedure for deriving the RGB drive currents from the mixing ratios is detailed in the following steps.
First we calculate the RGB mixing values. In this case, we obtain the RGB mixing ratio from the second LED data set presented in Table 1 (4.1:10.6:1.0). We sum that ratio (4.1+10.6+1.0 = 15.7) in preparation for subsequent calculations.
Factoring LED specs
Next, you must refer to the technical datasheet for each LED, and note the typical luminous intensity value for red, green, and blue. In this example, we will use the typical values 0.745 cd, 1.60 cd, and 0.38 cd, respectively.
Target Intensity (cd) = TL × (PP/1000)2 = 8000 ×(12.5/1000)2 = 1.25 cd.
Having determined the total required intensity per pixel, we can calculate the respective luminous intensity required for the red, green, and blue emitters using the formula:
(R, G or B Mixing value/Sum of RGB mixing value) × Target intensity :
Red = (4.1/15.7) × 1.25 = 0.3264cd
Green = (10.6/15.7) × 1.25 = 0.84395 cd
Blue = (1.0/15.7) × 1.25 = 0.0796 cd
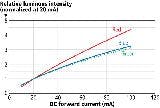
Next, we must return to the LED data sheet. You can estimate the drive current required to produce the desired luminous intensity using the drive current vs. light output graph in the LED datasheet (Fig. 4). Using the example graph, the drive currents required to produce the desired luminous intensities for the three emitters are approximately 8.8 mA for red, 10.5 mA for green, and 4.2 mA for blue. These current requirements can be used to determine the hardware component values used to bias the driver ICs and the variable values used to set the output range of the LED driver software.
Delivering optimal color
This exercise illustrates the challenges involved with achieving an accurate target white output from LED displays as a result of the spectral properties of the red, green, and blue LEDs. The LEDs used for electronic signs have spectral properties that are not identical to those of the corresponding phosphors used in traditional CRT displays.
Using the traditional 3:6:1 ratio will result in inaccurate reproduction of a target white illuminant. A new ratio should be calculated for each application. These calculations are also to be made using the target white point and luminance level that customers want to use for their particular design. In these LED-based applications, the mixing ratio must be calculated based on the specific spectral characteristics of the light produced by the red, green, and blue emitters before determining each device’s drive current requirements.
The straightforward procedure detailed here is an important tool for designing full color signs. It enables the engineer to select the LEDs and drive values that insure the display meets the customer’s performance requirements. This method also allows a designer to quickly re-estimate the RGB mixing ratio and drive current requirements for an application if a change occurs to the LEDs used and therefore the chromaticity coordinates, to the target white point, to the pixel pitch, or to the target luminance.
SIDEBAR: Calculate RGB color mixing values using the center of gravity method
In everyday practice, designers of signs or other color-lighting products can usually obtain the mixing ratio for a target color from widely available software packages. For a person unfamiliar with color mixing theory, however, deriving the ratios manually using the technique demonstrated here will help develop a better understanding of the process.
There are three commonly used methods for deriving additive color mixing ratios in displays and lighting systems: tristimulus values method, center of gravity, and vector diagram.
For the purposes of this tutorial, we will use the center-of-gravity technique to illustrate how the 3:6:1 color mixing ratio used by most CRT-based displays was derived from the properties of the standard red, green, and blue phosphors and the D65 target white illuminant, which were defined by the early television industry and are still used today.
The spectral characteristics of the red, green, and blue LED emitters are provided in manufacturers’ data sheets as coordinates. A similar set of coordinates define the D65 target white illuminant, which is typically chosen to match the requirements of the target application and is most likely determined by the customer requirements for the end product in question. Once all the coordinates are plotted onto the CIE 1931 diagram (see Fig. 3 from the main article) they may be used to derive the RGB mixing values required to produce the target white illuminant. You take the set of (x,y) coordinates plotted in Fig. 3 and work through a relatively simple progression of algebraic equations to determine the ratio mix. For convenience, those coordinates are:
Red: 0.67, 0.33
Green: 0.21, 0.71
Blue: 0.14, 0.08
D65 White Point: 0.3128, 0.3292
Step 1: Using the initial values, first solve the linear equation
that describes a line formed between the red and blue color coordinates that passes through the Purple Point (P). You first determine the line’s slope (mRB):
mRB = (yR – yB) / (xR – xB) = (0.33-0.08)/ (0.67-0.14) = 0.4717
Now you can calculate the constant C using the blue coordinates:
CRB = yB –mRB × xB = 0.08 – 0.4717 × 0.14 = 0.01396
Solving for the linear equation for y yields an equation that represents the line between the blue and red points:
y = 0.4717x +0.01396
Step 2: Now derive a second linear equation (y = mx+c) that describes the line that is formed between the green point and the purple point and that passes through the target white point D. The D coordinates provide the second set of coordinates required for the derivation along with the green coordinates.
mGD = (yG – yD) / (xG – xD) = (0.71-0.3292)/ (0.21-0.3128) = -3.7043
CGD = yG –mGDB × xD = 0.71 – (- 3.7043) × 0.21 = 1.4879
y = -3.7043x +1.4879
Step 3: Now we have two linear equations with two unknowns. Thus, we calculate the coordinates of the purple point that is located at the intercept point of the two linear equations.
y= 0.4717x +0.01396
y= -3.7043x +1.4879
We can solve for x because linear equations are both equal to y:
0.4717x +0.01396 = -3.7043x +1.4879
4.176x = 1.47394
x = 0.35296
Now we can solve for y:
y = 0.4717(0.35296)+0.01396 = 0.18045
The resulting x and y coordinates for the purple point P are (0.35296, 0.18045).
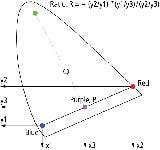
Step 4: Now we can calculate the RGB color-mix ratio required to produce the D65 illuminant by applying a ratio of mixtures formula R = - (y2/y1) × (y1-y3) / (y2-y3). The geometric basis for the solution is illustrated in Fig. S1.
RRB= -(0.33/0.08) × (0.08-0.18045) / (0.33-0.18045) = 2.7707
That equates to a blue-to-red ratio of 1.0 to 2.77. Next, we calculate the green-to-purple ratio using the green, white, and purple coordinates as y1, y2, and y3, respectively:
RGP= - (0.71/0.18045) × (0.18045-0.3292) / (0.71-0.3292) = 1.53696
Next, we calculate the fraction of the red ratio required to produce the purple color:
2.7707/ (2.7707+1.0) = 0.7348
We then calculate the fraction of the blue ratio required to produce the purple color:
1.0 / (2.7707+1.0) = 0.2652
The resulting un-normalized R:G:B ratio is: 0.7348:1.53696:0.265. After adjusting all values to a normalized blue value of 1.0, the resulting estimated R:G:B ratio values become: 2.77:5.79:1 or approximately 3:6:1.


